
Covid-19
Gaining Perspective – Covid-19
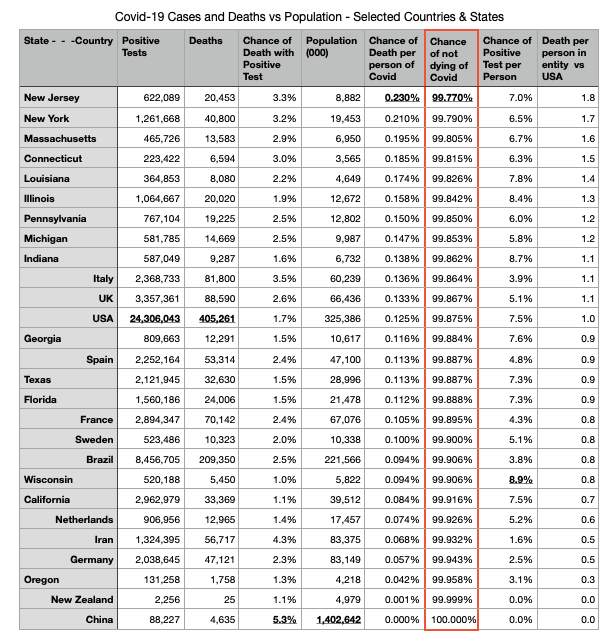
Each day, the media presents us with statistics such as 24 million people in the US have tested positive for the virus and over 405,000 have died from it since early 2020.
Covid vs deaths from all causes in perspective
The chart “Causes of death – USA – 2017” represents comprehensive data from the US Government. With a total population of 326 million and deaths in 2017 of 2.81 million, on average we have 0.87% chance of death from any cause in 2017. This is a 99.14% of living in that year.
When accounting for deaths in 2020 If deaths from all other causes remain the same and Covid is additive, then deaths will have increased to 3.22 million, a 14.4% increase. But we know that over 50% of the deaths from Covid are amongst people with other conditions. Thus, there is a likelihood that the increase will be less.
Cases and deaths by region in perspective
When accounting for deaths in 2020 If deaths from all other causes remain the same and Covid is additive, then deaths will have increased to 3.22 million, a 14.4% increase. But we know that over 50% of the deaths from Covid are amongst people with other conditions. Thus, there is a likelihood that the increase will be less.
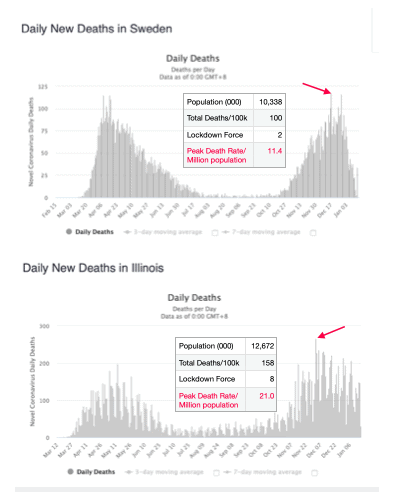
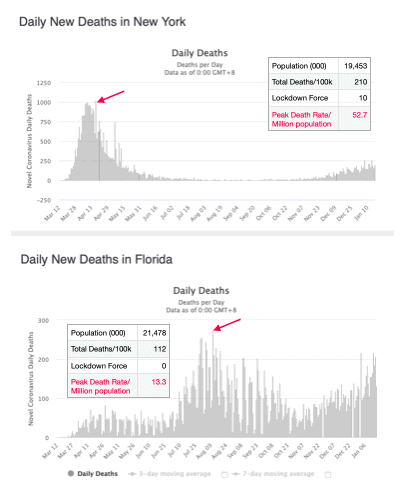
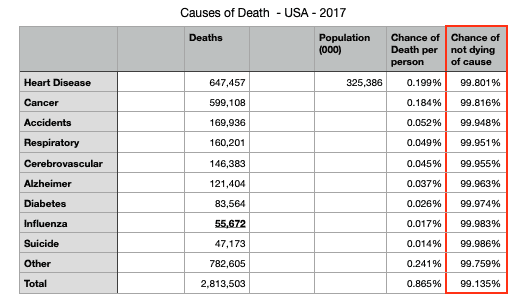
Effects of the government lockdowns in perspective
Places that did not lockdown included Sweden and Florida. As can be seen, their death rates are significantly less that New York and Illinois that did. A notable exception is California with one of the lowest death rates in the county.
Examining the peak daily deaths confirms that states that locked down had higher rates with Illinois 1.8 times Sweden and New York 3.96 times Florida.
Even if lockdowns don’t increase deaths, they cause massive economic and emotional negative effects for a disease that has over a 99% survival rate for the average person.